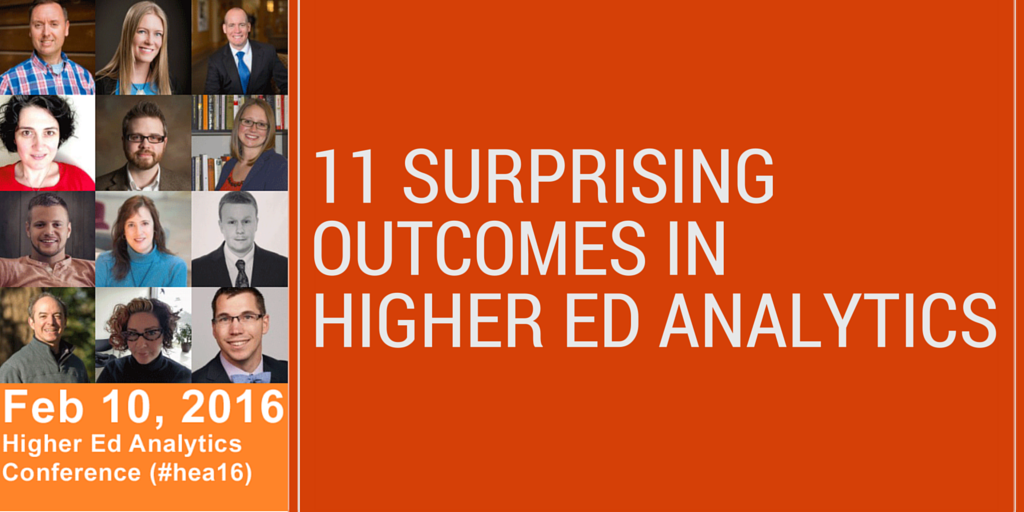
Surprises in Higher Ed Analytics?
Who said there were no suprises in data and analytics?
I’ve been focusing on higher ed analytics and digital performance measurement for a very long time – and I’m still amazed at how this field can be full of surprises – despite what many think.
That’s why I asked the 11 Higher Ed Analytics Professionals presenting with me at the 2016 Higher Ed Analytics Conference to share with us the most suprising outcome they experienced last year.

Check out these 11 surprising outcomes your higher ed colleagues have witnessed and find out what they’ve learned in the process.
Alan Etkin, Senior Analyst – British Columbia Institute of Technology
 2015 was the year we started to explore the concept of assisted conversions. What we discovered changed the way we look at the impact of our marketing campaigns.
Assisted conversions is a Google Analytics reporting feature that not only tracks the direct conversions from someone who responded to an ad and converted in the same visit, but it also tracks the more realistic scenario where someone responds to an ad, visits the site, goes away and returns to convert at a later date. In the lingo of GA, the conversion was assisted by the original ad.
We used to begrudgingly report on our marketing campaigns at the end of each month with the traditional metrics of impressions, clicks, visits, and conversions. I say begrudgingly because even if impressions and visits were looking good, conversions were mostly pathetic. We calculated that our median days to conversion was 30 days – meaning that we weren’t reporting on the link between our ads and outcomes.
The next piece in solving the puzzle of how our marketing spend was actually doing, was to use another GA feature called lookback, which connects your current reporting period with conversion activity that took place earlier. In the assisted conversion reports, you can set the lookback as far as 90 days. Think about it: you’re running a 3 month campaign, and in the 3rd month, you can associate conversions with folks who saw the ad back when the campaign started.
We can now identify that a campaign had 25 direct conversions in a month, and 400 assisted conversions from people who saw the advertising earlier. Add in goal values and marketing spend, and we get awesome, world-changing reports that accurately reflect our return on advertising spend.
Joshua Dodson, Director of SEO – Southern New Hampshire University
 Small changes can make big differences.
I am always surprised when I see how small tweaks can have large impacts over time. By now I shouldn’t be surprised, but I still am.
At the same time, though, sometimes bigger changes can have less of an impact than anticipated. The important thing is to watch the changes closely and see how the needle moves. Know the metrics (KPIs) that will indicate success or failure and watch them carefully.
Tatjana Salcedo, Web Strategist – University of Vermont
 We’ve had a lot of different people on campus collecting web analytics for years, but in 2015 I saw a huge uptick in the quantity and quality of analyses.
Folks around campus are much more on board with examining traffic across the institution (and not just within their smaller spheres of influence), setting goals in Google Analytics, utilizing campaign tracking variables, and creating regular detailed reports. I’m experiencing a lot more synergy and collaboration with the offices in using analyses to inform, and often drive, marketing efforts across the institution.
Avalee Harlton, Service Coordinator & Web Content Designer/Editor – York University
 Our university encourages everyone to use one single account to track most web pages on our domain, however, there are a few Faculties that have held out from moving over to the main account. When one of the Faculties (aka Colleges) that we expect to never make the move get in touch to join the rest of the group, it’s so exciting!
From the beginning we have tried to be transparent about the data we’ve collected by allowing anyone from campus to view the account. By being able to see the data, groups can see how they fit into the big picture, and what they’re missing out on by not joining in.
Not only has it taught me that it’s important to continue to spreading the message about the value in tracking metrics across the entire website, but that in the long term, our transparency pays off.
Lindsay Nyquist, Director of Digital Communications – Fort Lewis College
 The most surprising outcome I’ve seen in working with digital analytics is just how powerful they can be, and how they can drive so much of our decision-making.
I used to casually measure social media statistics on the months that I remembered, but now I actively and regularly gather stats in all forms of digital communication: social media followers, engagement, reach, and posting frequency; email open rates, click rates, unsubscribes, and SPAM reports; virtual tour visits and time spent; and views on stories published.
These statistics now drive so much of our strategy – what types of content to create and how to promote them, how to utilize email as an effective communication tool, and how to best use our limited marketing budget.
Jens Larson, Manager of Student Communication Strategies – Eastern Washington University
 The first surprising moment came when I realized that most institutions—even most really good institutions—don’t have a well-coordinated email analytics strategy. I’ve read over 2,500 emails from 300 institutions this year, and our performance as an industry is shockingly bad.
The second moment is more positive: good emails remain relevant for a really long time. Recipients seem to treat them as microsites, especially if the email collects relevant information in an action-oriented, mobile-friendly way. You can probably think of several emails you’ve received that are helpful in this way.
Digital analytics really highlight how non-promotional and non-transactional email content can transform engagement.
Dr. Liz Gross, Social Media and Market Research Strategist – Great Lakes Educational Loan Services, Inc.
 The thing that surprised me most in 2015 was the level of technical detail required to successfully implement analytics in a large, database-driven organization.
While I teach the course on social media measurement for higher ed at Higher Ed Experts, I work for a student loan servicing company. Most of what we do is tied to customer records or associated data tables. To collect the right data, at the right time, from the right source, I’ve had to learn a lot about our backend technical infrastructure.
I’ll never know as much as our developers, but I have to know enough to have an intelligent conversation with them about what data points I want to tie to our digital marketing and communication efforts. Anything I can do to make their jobs easier will speed up my timeline for organization-wide analytics. I’ve learned that even though I’m an expert in my field, there are intersecting fields that are just as important, and I have to respect people with expertise in those areas so we can work together effectively.
Bryan Fendley, Director of Campus Web Services – University of Arkansas at Monticello
 I was surprised when I started using the Google Chrome page analytics extension. Even though I had been looking at similar data through Google Analytics, the extension reminded me just how important visualization is for everybody.
I learned things don’t have to be complicated to be useful. Beware of becoming a data snob, and never underestimate the power of visualization. Screenshots from Google Chrome page analytics also work great in meetings.
Robert Bochnak, Assistant Director, Alumni Marketing and Communications – Harvard Business School
 I was most surprised by our success, especially compared to fiscal year 2014/2015, in increasing traffic to the Harvard Business School’s alumni website via Twitter.
During FY 14/15–July 1, 2014 to June 30, 2015–our social media efforts on Twitter led to 4,987 clickthroughs to pages on the alumni website. During the first five months of the FY 15/16 alone, roughly July 1, 2015 to December 1, 2015, we generated 5,315clickthroughs to the alumni website.
Adam Coulter, Social Media Marketing Specialist – Curry College
 The most surprising outcome – in my work with digital analytics – would have to be the realization of just how many users are visiting our Twitter profile page.
I had always thought (rightly or wrongly influenced in part by Facebook Insights on how many people visited our Facebook Page) that most people engaged with our Twitter content via the feed. But since Twitter updated their analytics platform this year we have seen that on average close to 10,000 people visit our profile page a month.
This surprised me. What I’ve therefore learned is that we should be paying even closer attention to how our profile looks and feels and that we should certainly be using the “pinning†feature to garner greater attention on important messages.
Chase Baker, Social & Digital Media Coordinator – Colorado State University
 I was surprised to see, in numbers, the rise of Instagram.
Compared to other platforms, our Instagram account experienced a major surge in engagement rate and growth in followers. We experienced a 163% increase in average likes per photo from 2014 to 2015, which taught us that Instagram should be less of an afterthought and more of a key component to our strategy.
So, what was YOUR biggest suprise in your work with Analytics?
Tell us by posting a comment below!
And, if you want to learn more from these higher ed analytics pros, make sure to register your team for the 2016 Higher Ed Analytics Conference (Feb 10, 2016).


New post: College Web Editor – 11 #HigherEd & #HESM Analytics Surprising Outcomes in the Past 11 Months https://t.co/LEfgTd3tTR
College Web Editor – 11 #HigherEd & #HESM Analytics Surprising Outcomes in the Past 11 Months: Suprises in Hig… https://t.co/6wqVjPs2Rw
RT @bloghighed: New post: College Web Editor – 11 #HigherEd & #HESM Analytics Surprising Outcomes in the Past 11 Months https://t.co/LEfgTd…
College Web Editor – 11 #HigherEd & #HESM Analytics Surprising Outcomes in the Past 11 Months https://t.co/wpcKIoMqQ2
11 #HigherEd & #HESM Analytics Surprising Outcomes in the Past 11 Months https://t.co/PwcrdyqcMo https://t.co/7optN2BrAT
“College Web Editor – 11 #HigherEd & #HESM Analytics Surprising Outcomes in the Past 11 Months” https://t.co/l7ZCyDPibl #highereducation
11 #HigherEd & #HESM Analytics Surprising Outcomes in the Past 11 Months https://t.co/OJAO9Jupky
11 #highered analytics professionals share their surprising outcomes from 2015 https://t.co/QFNMAjgqNE https://t.co/fXfSRYrUNF
11 #HigherEd & #HESM Analytics Surprising Outcomes in the Past 11 Months https://t.co/QePgqUePVn https://t.co/ioPjQeLEC5